A secret to Event Processing
At Cherry, we process hundreds of events per second. For Cherry users, we capture and process data every time their customers visit a web page, take an action, purchase an item, etc. Processing events is a mission critical function to understand customer behaviour in real time. So when we discovered that processing latency for some Cherry users was several days, finding and solving the issue became our #1 priority.
I wrote this to help anyone in a similar position and share what we learned.

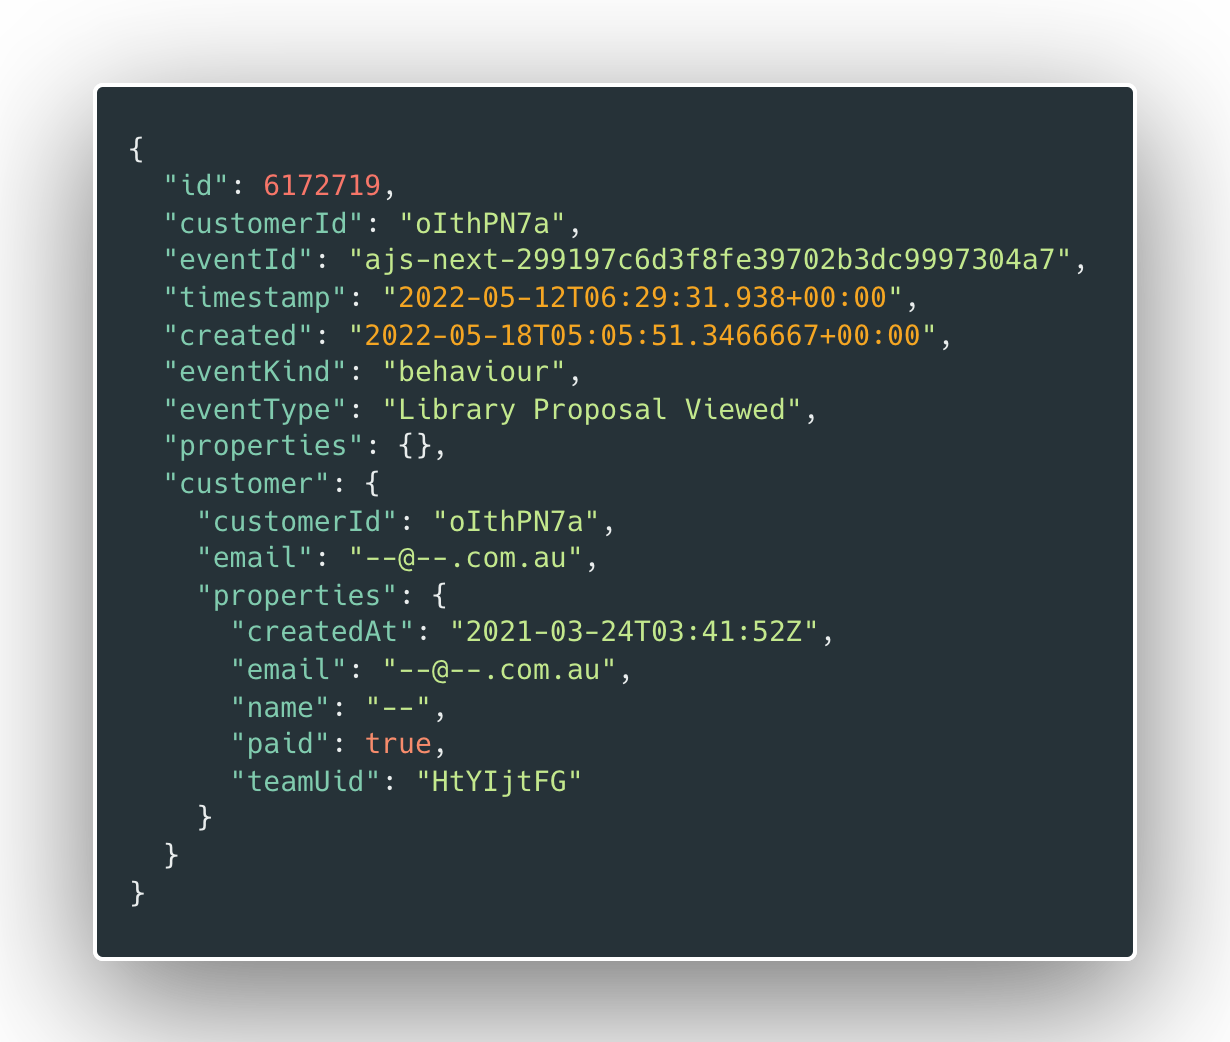
A typical event payload, with latency timestamps emphasised
The investigation
Why was it taking several days for some events to show up in Cherry? When Cherry events are ingested they are placed into an Azure Event Hub for processing by a (theoretically) scalable backend running on Azure Functions. This process should be near real time. But (as seen in the event data above) the difference between the event timestamp (i.e. ingestion time) and created time (i.e. process time) was growing rapidly and was at ~6 days.
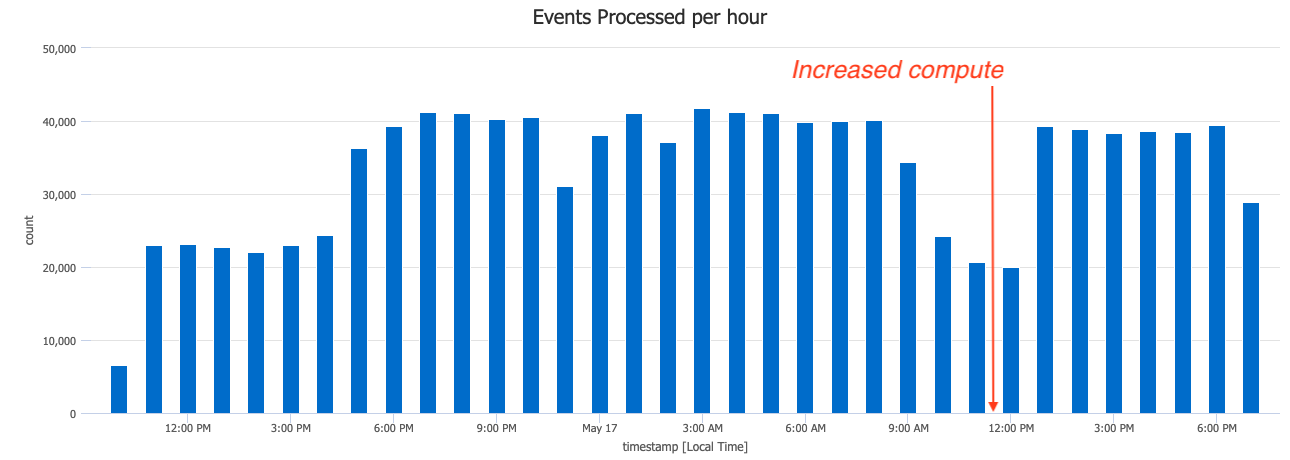
Our first instinct was to increase the total number of workers processing events. Things are slow — throw more compute at it! However, this didn’t actually improve the latency or even the total number of events being processed per second.

Plotting the event processing throughput using KQL
The complication
Increasing the number of workers (i.e. increasing compute) didn’t really solve the issue. If the choke point was the number of workers, then we’d expect the # of events processed to increase proportionally — but it didn’t increase above it’s prior maximum. This implied that the choke point existed outside the event processor, either at the input or the output.
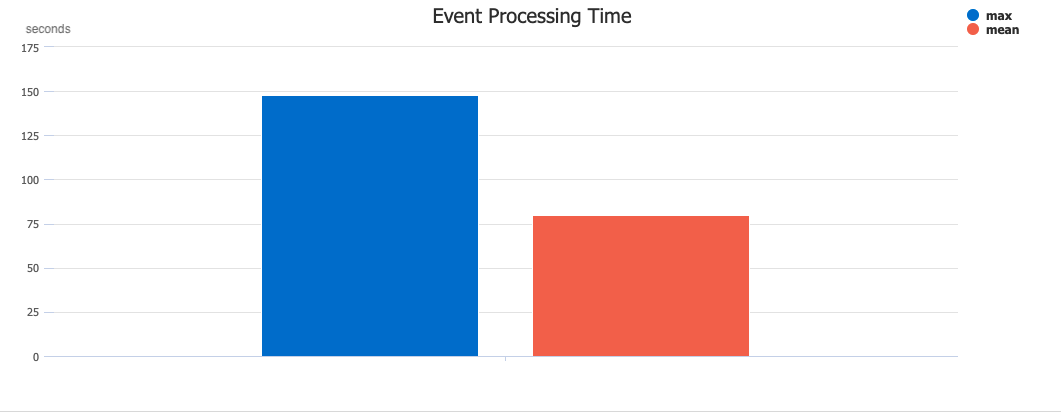
Since the input to the event processor was an Azure Event Hub that was running at well below its theoretical maximum throughput, we naturally turned to the database to which events were being written. Inspecting the query performance, we discovered one query was taking a very long time, typically 80 seconds! This one query was taking so long, that the mean time to process a single event had blown out to 85 seconds.
 Plotting the max and mean event processing time using KQL
The discovery
Why was this query taking so long? Turns out, it was “find-and-replace” logic, written by yours truely, for the brilliantly useless functionality that replaced an event if its ID already existed in the database. There is a reason why event logs are generally append-only! As the number of events in the database had grown, the performance of this previously innocuous query had steadily degraded. At first, the latency was only a few seconds, then a few minutes, but soon it became hours and days. Since the situation wasn’t really an “error” in the conventional sense, they weren’t picked up by our automated monitoring systems. Nonetheless, with this knowledge in hand, we were ready to take action.

Results of the fix — a dramatic improvement
The solution
Going back to first principals, we realised that an event log shouldn’t be responsible for updating events that already exist. It doesn’t scale and it’s uncommon behaviour. When we decided to remove the offending query from the event processor, the processing time dropped dramatically, from 80 seconds to fractions of a second. We let the a database index deal with clashing IDs, and pass any errors into a dead letter queue. The lesson here is twofold
Keep your event processors FAST. Slow event processing can slowly backup your entire pipeline and cause serious congestion. Event logs should be append only. Updates (which happen rarely if at all) should be handled by a separate process. Learn more Cherry is a SaaS tool for improving ROI from promotion campaigns. Learn more at our website.